Sustainability & Cost Intelligence for Commercial Real Estate Brokers
One Broker Score, backed by 47 government datasets — from NYC LL97 to Canada's NBC 2025. Insights brokers can take into a meeting tomorrow, across 7M+ property records in the US and Canada, with measured energy data for NYC, Chicago, Boston, Philadelphia, DC, Seattle, Toronto and Ontario.

7M+ Property Records
Government property data, US & Canada
What's your listing missing?
Pick a property. See what you walk into a meeting with today — versus with ecoMetric tomorrow.
47 Authoritative Data Sources
Government benchmarking, climate, compliance, assessor, and location APIs — normalized into one schema.
Everything You Need for Property Intelligence
From raw government data to broker intelligence you can share tomorrow — scores, costs, compliance, and reports.
Green & Broker Scores
ESG scores plus a 0-100 Broker Score — operating costs, compliance risk, and green premium in one number.
US + Canada Coverage: 655K+ Canadian Properties
7M+ property records across 225+ cities. 655,000+ Canadian records covering Edmonton, Calgary, Vancouver, Toronto, and 220+ Ontario cities.
Location Intelligence
Walkability, transit, bike scores, and air quality data for every property — quantify neighborhood value.
Solar & Operating Costs
Rooftop solar potential, estimated annual energy/water costs, and cost per sqft — ready for listing sheets.
Regulatory Compliance
Maps properties to 14 building performance standards — NYC LL97, Ontario EWRB, Toronto EWRB, Montreal GHG, Vancouver Zero Emissions, and more.
Property Comparison
Compare 2-5 properties side by side on scores, costs, compliance, and certifications.
Broker One-Pager
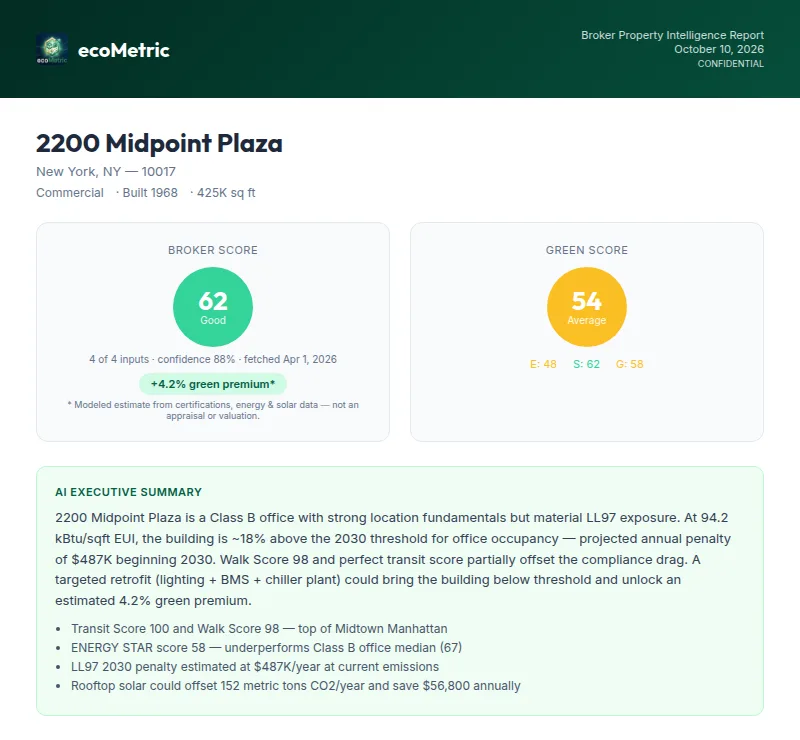
Client-ready PDF with scores, location intel, operating costs, compliance status, and green premium estimates.
Government Data
Regularly updated from authoritative sources. Market context, area benchmarks, and comparable properties.
API-First
RESTful API for developers. Build property intelligence into your own PropTech applications.
One number a broker can defend in a meeting
We fuse 47 government datasets into a single 0–100 score covering operating cost, location quality, regulatory exposure, and green premium — each with its own defensible sub-score and source trail.
Example
Marine Gateway Tower
Vancouver, BC · 485,000 sqft · Class A
- LEED Gold · BC ZE 2030 compliant
- Est. op cost $4.20/sqft · 340kW solar potential
- Sources: BC EWRB, NRCan, Walk Score, Google Solar
Operating Costs
Est. utility + water cost vs. regional median
Location
Walk + transit + bike score (live API)
Regulatory
Compliance margin vs. active BPS laws
Green Premium
Certifications, solar potential, carbon risk
What you can count on
14-day free trial
No credit card required
Government data only
47 official sources, no scraping
Transparent scoring
Weights, sources & confidence on every score
US + Canada coverage
7M+ property records, 225+ cities
How it Works
Three steps from raw data to actionable property intelligence.
NYC LL84
Benchmarking
Ontario EWRB
Canada
EPA ENERGY STAR
Federal
Google Solar
Rooftop
FEMA NRI
Climate
Walk Score
Location
NRCan
Canada
Cook County
Assessor
Connect Data
We aggregate 47 authoritative data sources across 225+ cities — energy benchmarks, climate risk, solar potential, air quality, and Canadian EWRB data.

Score & Analyze
ESG and Broker Scores with estimated operating costs, compliance risk, and green premium estimates.
Close Deals
Compare properties, generate client-ready one-pagers, and share broker intelligence via dashboards or API.

Ready to give your clients a competitive edge?
Start scoring properties today. Broker Scores, compliance intel, and client-ready reports — all in minutes.