How to Assess a Commercial Property's Climate Risk in 60 Seconds
Climate risk has moved from ESG footnote to first-line underwriting. Here is a practical 60-second framework for assessing physical and transition risk on any commercial property using public data.
Ten years ago, climate risk was an ESG-team concern filed away in annual reports. Today it is a first-line underwriting, due diligence, and insurance question on every commercial real estate transaction of meaningful size. Lenders require it. Insurers price it. Sophisticated buyers negotiate against it. Brokers who cannot speak to it credibly lose deals.
Here is a practical 60-second framework for assessing climate risk on any commercial property, using publicly available data and a clear separation between the two categories that matter: physical and transition.
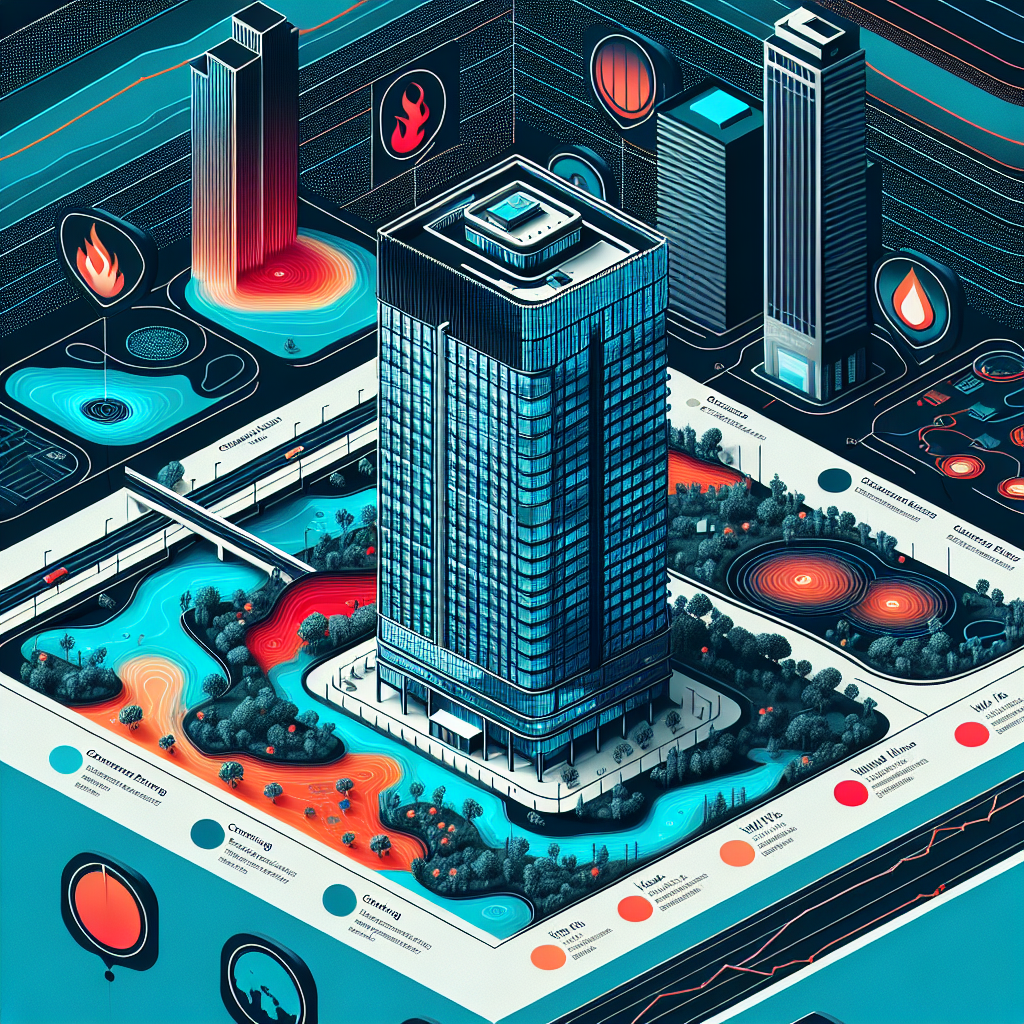
The two categories of climate risk
Physical risk is the direct exposure of a specific property to climate-driven hazards. It includes:
- Coastal and inland flooding
- Wildfire (wildland-urban interface exposure)
- Extreme heat (heat wave frequency, cooling load stress)
- Sea level rise (for coastal markets)
- Water stress (for markets dependent on strained aquifers)
- Severe wind (hurricane/tornado exposure)
- Subsidence and permafrost thaw (specific to certain markets)
Transition risk is the financial exposure to regulatory, market, and policy changes driven by the global climate transition. It includes:
- Building Performance Standards (LL97, BERDO, BEPS, EWRB)
- Carbon pricing mechanisms
- Insurance premium escalation
- Lender underwriting shifts
- Tenant preference shifts (flight to green)
- Stranded asset risk for carbon-intensive buildings
Both matter. A property with low physical risk but high transition risk (a non-compliant Class B office in NYC) is as structurally exposed as a property with low transition risk but high physical risk (a coastal Class A trophy in South Florida).
The 60-second physical risk check
Step 1: Flood zone (10 seconds)
Pull the property's FEMA flood zone designation. Zones starting with "A" or "V" are 100-year flood zones (high risk). "X" zones are outside the 100-year zone. "X shaded" zones are in the 500-year zone.
Beyond FEMA, check updated private models — First Street Foundation and others produce more current risk assessments that include climate projections. FEMA maps are often 15+ years out of date.
Step 2: Wildfire WUI (10 seconds)
For Western US and Canadian properties, check whether the property sits in a Wildland-Urban Interface (WUI) zone. The USDA Forest Service and various state agencies publish WUI maps. For California specifically, CalFire's Fire Hazard Severity Zones (FHSZ) are the authoritative source.
Step 3: Extreme heat projection (10 seconds)
For major urban markets, check 2050 heat projections from NOAA or similar. A 20-year doubling of days over 95°F significantly stresses existing HVAC systems and can push a building above its BPS cap in years it previously complied.
Step 4: Sea level rise and storm surge (10 seconds)
For coastal markets, use NOAA's Sea Level Rise Viewer. Overlay 2050 and 2100 projections. A property that's currently 8 feet above mean high water may be 2 feet above it in 2100 — which means routine nuisance flooding.
Step 5: Wind and hurricane (10 seconds)
For Gulf Coast and Atlantic markets, check the property's wind zone and hurricane storm surge category. Both are publicly available.
Step 6: Subsidence and ground stability (10 seconds)
For markets built on fill, alluvial soils, or subsiding land (South Bay Area, parts of New Orleans, parts of Mexico City), check USGS subsidence data.
In sixty seconds you have a physical risk profile that matches what sophisticated lenders now do as part of routine due diligence. Not perfect, but a defensible first read.
The 60-second transition risk check
Step 1: BPS exposure (15 seconds)
Is the property in a Building Performance Standard jurisdiction? If yes, pull the current benchmarking report and compare against the next compliance period's cap. Calculate projected fine exposure.
Step 2: Carbon intensity (10 seconds)
What is the property's emissions per square foot relative to peer properties? High-carbon-intensity properties face steeper regulatory and insurance risk over time.
Step 3: Electrification readiness (15 seconds)
Does the building have the electrical capacity to support heat pump conversion? Older buildings often lack the service capacity, which means a $500,000–$2 million electrical upgrade before the main retrofit can start.
Step 4: Insurance trajectory (10 seconds)
Has the property's insurance premium increased significantly in the past 3 years? In climate-stressed markets (Florida, coastal California, parts of Texas), insurance cost escalation is now a material driver of OpEx.
Step 5: Lender trajectory (10 seconds)
Are the main lenders active in this market tightening their ESG or climate underwriting? Several major lenders now require 2030 BPS compliance plans as a condition of refinance.
Combined physical + transition = a 2-minute complete climate risk picture.
How to categorize risk in a deal memo
Using the framework above, you can produce a simple deal-memo characterization:
| Property | Physical | Transition | Overall |
|---|---|---|---|
| Hudson Yards Class A | Low (1% flood, limited heat) | Low (LEED Platinum, 2030-compliant) | Low |
| 1970s Class B Midtown office | Low | High (LL97 2030 fines $200k+/yr) | High-transition |
| Houston Class A office | Medium (hurricane, heat) | Low (no BPS) | Medium-physical |
| Miami coastal Class B condo | High (sea level, hurricane) | Medium (insurance escalating) | High |
| Oakland 1960s multifamily | Medium (wildfire adjacent, earthquake) | Medium (state BPS) | Medium |
How climate risk is priced today
Insurance: Premiums in high-physical-risk markets have risen 40–150% in the last 5 years. In extreme cases, insurance is withdrawing entirely (parts of Florida, wildfire-prone California).
Lenders: LTV haircuts of 5–10% now routine for high-climate-risk assets. Some lenders require climate vulnerability assessments (CVAs) as a condition of loan commitment.
Cap rates: The market is beginning to widen cap rates on high-risk assets, though this lags the other signals. Expect 25–50 bps of widening by 2030 in high-exposure markets.
Sale prices: Institutional buyers are now routinely asking for climate risk disclosures; high-risk properties see 3–8% discount adjustments.
The case for systematic climate risk in CRE workflows
If climate risk is now priced into insurance, lending, and valuation, it needs to be priced into broker workflows too. That means:
- Every listing memo includes a climate risk line.
- Every valuation model includes a BPS compliance scenario.
- Every due diligence checklist includes flood, fire, and heat assessment.
- Every tenant recommendation considers the building's long-horizon risk profile.
None of this requires heroic data engineering. The public data exists. The tools exist. What's needed is a standardized workflow that produces a consistent risk read on every property a broker touches.
Tools that help
Property intelligence platforms (including ecoMetric) now aggregate the public data sources needed for these assessments — FEMA, First Street, NOAA, benchmark data, BPS compliance status, and more — and produce a unified risk read by address. What took hours of manual research can now happen in seconds.
The real competitive advantage isn't the data. It's the workflow — the broker who routinely includes climate risk in every deal memo will earn trust faster than the broker who treats it as a specialty topic.
Closing frame
Climate risk in commercial real estate is not a question of belief or politics. It is a question of cash flow. Insurers have priced it. Lenders are pricing it. Buyers are pricing it. The only remaining question is whether the broker, owner, or advisor in the deal has priced it into the conversation. In 2025, the answer needs to be yes.